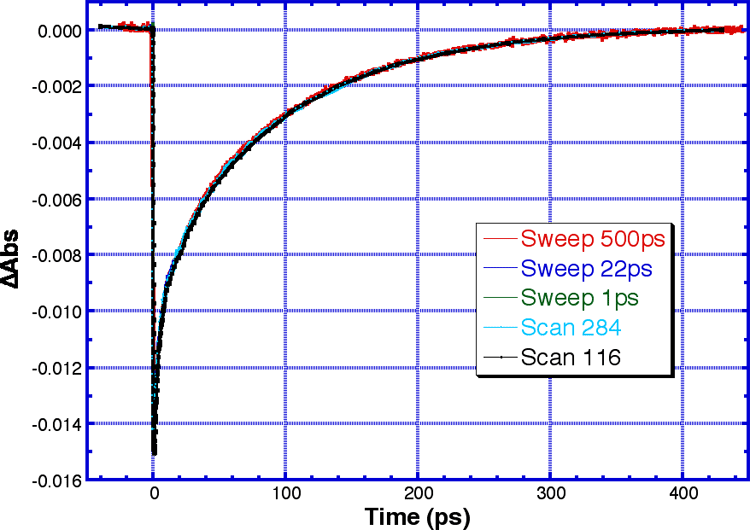
Single wavelength absorption kinetics, averaging by scan and sweep modes.
To evaluate the efficiency of noise reduction in the scan and sweep modes, three sets of experiments were performed, each using the same amount of instrumentation time (~ 24 minutes). Two sets of scans with different numbers of time points, and one set of three sweeps containing 1000 time points each with different time steps (1fs, 22fs and 500fs) were performed. In the figures 1 to 3, the backward sweeps are omitted for clarity. Thus, the displayed sweeps represent half the data collection times compared to the scans. When the traces were fit to retrieve rate constants and uncertainties, all the sweeps where used. Errors are estimated using F-statistic. The rate constant for which the uncertainty is sought is varied in fixed steps around the optimum value and the other parameters are fitted at each step. When the sum of squared deviations have increased by a factor of 1 + M/(N-M).F(M,N-M,1-P) the error limit is reached. (M; number of parameters, N; number of data points, P; probability level (in this case 68.25% or one standard division))
|
|
|
| 1) Superimposed sweep and scan traces. |
|
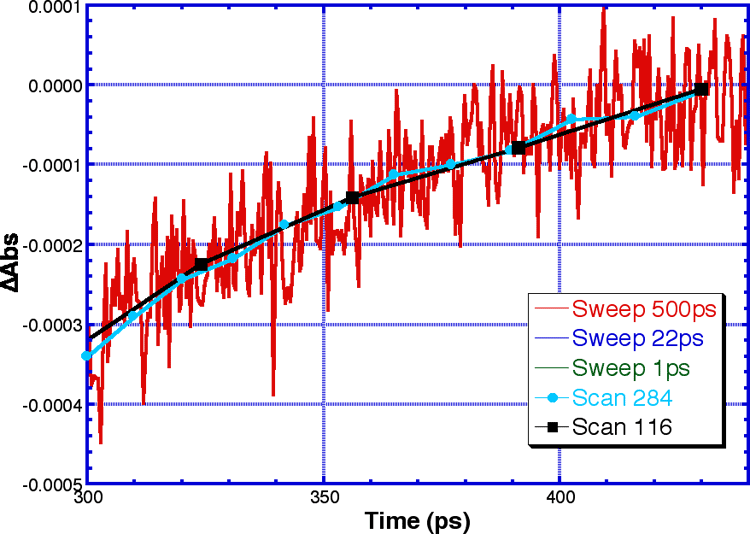
2) Excerpt of the region with low signal levels. |
 |
|
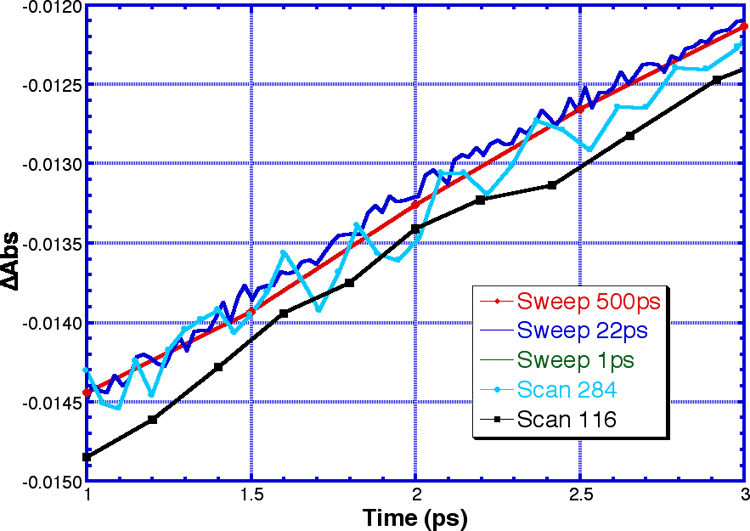
From the two excerpts of the kinetic traces, the effects of probe and pump noise in scan and sweep experiments are shown. In regions with low signal amplitude (fig 2) probe noise is dominant, and the sweep trace appears to be much noisier. In regions with high signal levels (fig 3), pump noise is dominates, and the sweep traces are less noisy despite significantly less averaging per point. |
| 3) Excerpt of the region with high signal levels. |
|
Result from the fits of the rate constants for the kinetic traces of figure 1-3.
|
Type of experim-ent
|
Number of time points used
|
Measurements / point
|
Number of repeats
|
Total measurements
|
k1 (1/ps)
|
Uncertainty 1 ±%
|
k2
(1/ps)
|
Uncertainty 2 ±%
|
k3
(1/ps)
|
Uncertainty 3 ±%
|
|
Scan
|
116
|
300
|
12
|
3600
|
0.309
|
13.3
|
0.0348
|
89.8
|
0.00975
|
36.7
|
|
Scan
|
284
|
500
|
4
|
2000
|
0.327
|
13.2
|
0.0445
|
52.0
|
0.00977
|
13.6
|
|
Sweep
|
5652
|
1
|
100
|
100
|
0.314
|
3.6
|
0.0365
|
16.1
|
0.00962
|
3.9
|
|
When the uncertainties of the fitted rate constants are examined, the importance of the increased number of time points and efficient reduction of pump pulse noise becomes obvious. In the sweep mode, the uncertainties are reduced by a factor of 3 to 4 compared to the scan mode. |